July 15, 2023


The Portfolio Manager Commentary is provided by Trustmark’s Tailored Wealth Investment Management team. The opinions and analysis presented are accurate to the best of our knowledge and are based on information and sources that we consider to be reliable and appropriate for due consideration1.
Economic Outlook
U.S. Durable Goods Orders were up 1.8% in May, similar to April’s increase. The Markit Purchasing Managers’ Index came in at 46.3 for June while the ISM Manufacturing Index came in at 46.0 for June. Therefore, both manufacturing data points are still in contractionary territory. The Markit Services PMI came in at 54.4 for June and the ISM Services PMI came in at 53.9 for June, both of which are more expansionary in nature. The NFIB Small Business Index remained a strong 91.0 for June versus 89.4 for May. Overall, the U.S. Unemployment Rate remained at a low 3.6% for June, slightly lower than the 3.7% in May. Average Hourly Earnings were up 0.4% in June and 4.4% year-over-year in June. The U.S. Consumer Price Index was up 0.2% for June and up at a lower 3.0% for the year ended June. Core CPI was a bit more stubborn, at +4.8% for the year ended June. Producer Prices were flat for the year ended June 2023. So hopefully that flow through into consumer prices continues a bit longer.
Fixed Income
The U.S. Treasury Yield Curve remains inverted, with the 10-year yield trading at 3.79%, 97 basis points below the 2-year yield of 4.76%. At its recent June meeting, the FOMC kept the Federal Funds target rate unchanged at a range of 5.00% -5.25%. The minutes of this meeting reflect that the FOMC remains strongly committed to keeping inflation down near 2% per year while maintaining full employment. The FOMC continues to imply that they will increase interest rates one or more two times this year. The three-month and six-month U.S. Treasury Bills currently yield in a range of 5.40%-5.50%, which now imply a higher probability of a rate hike at the late July Fed meeting.
Yield Curve

Current Generic Bond Yields

Equity
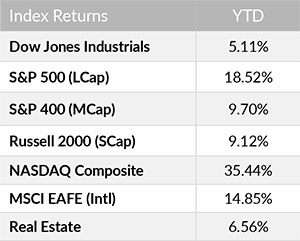
US Equity is positive for the month as the S&P 500 gains 1.55% with a year-to-date return of 18.52%. After a strong breakout at the beginning of June, the S&P 500 large cap index has gains of ~8% since. Along with this return, we’ve seen stronger conviction from the market in the form of market breadth (which is overall participation of stocks in an index’s returns). Since the beginning of May, the majority of stocks in the S&P 500 have moved above their 200-day moving average to help contribute towards the index’s returns, whereas before, returns were mostly led by the top 10 weighted names in the index (Apple, Nvidia, Tesla, Meta, etc..).
Along the theme of tech names leading returns, growth (22.67%) has dominated value (+13.95%) year-to-date, which is quite the contrary to the prior year. This has been led by Technology (+42.94%), Communication Services (+41.14%), and Consumer Discretionary (36.02%), whereas Energy (-4.55%), Health Care (-2.53%), and utilities (-3.99%) are the sole negative sectors.

Related Articles
May 1, 2023
The U.S. Index of Leading Economic Indicators was down 1.2% for March after having been down 0.50% for February.
May 15, 2023
The Markit Purchasing Managers’ Index (PMI™) came in at 50.2 for April versus 50.4 for April.
June 15, 2023
U.S. Productivity was down 2.1% for first quarter of 2023, while Unit Labor Costs were up 4.2% for the same quarter.


