July 1, 2023


The Portfolio Manager Commentary is provided by Trustmark’s Tailored Wealth Investment Management team. The opinions and analysis presented are accurate to the best of our knowledge and are based on information and sources that we consider to be reliable and appropriate for due consideration1.
Economic Outlook
U.S. Durable Goods Orders were up 1.7% in May after having been up 1.2% in April. Real GDP increased at 1.8% in the first quarter of 2023 versus +1.6% for the prior quarter (both annualized). The Chicago Purchasing Managers Index continues to be stubbornly low, with a May reading of 41.5. Further, the U.S. Index of Leading Economic Indicators came in at a negative 0.7% for May after having been down 0.60% in April. The University of Michigan Sentiment Index remained at 64.4 for June versus 63.9 for May. New Single-Family Home Sales came in at 763,000 units on an annualized basis, still a bit below the long-term trend, which should be in the 800,000’s. The NAHB Housing Market Index came in at a strong 55 versus 50 expected. Finally, the PCE Deflator, a measure of inflation, had a reading of 0.13% in May versus 0.36% in April (both non-annualized).
Fixed Income
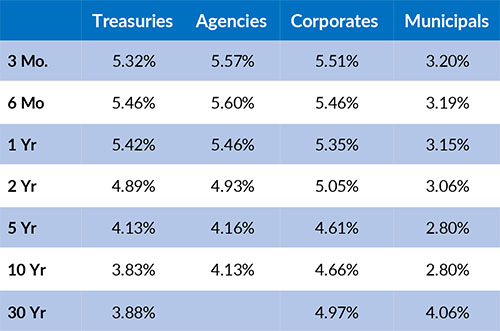
The U.S. Treasury Yield Curve remains inverted, with the 10-year yield trading at 3.84%, 105 basis points below the 2-year yield of 4.89%. At its recent June meeting, the FOMC kept the Federal Funds target rate unchanged at a range of 5.00% -5.25%. The minutes of this meeting reflect that the FOMC remains strongly committed to keeping inflation down near 2% per year while maintaining full employment. The FOMC continues to imply that they will increase interest rates one or more two times this year. The three-month and six-month U.S. Treasury Bills currently yield in a range of 5.31%-5.44%, which now imply a higher probability of a rate hike at the July Fed meeting.
Yield Curve

Current Generic Bond Yields

Equity
June was a solid month for US equity as the S&P 500 Large Cap index returns 5.39%. Eyes on the Fed as they continue to hold rates steady with expectations for one to two more rate hikes for the year. This narrative has quickly changed, as only a few months ago it was widely expected for rates to be cut in early fall.
Market breadth (the overall participation of stocks in an index’s returns) has improved as most stocks in the S&P 500 are now contributing to the index’s returns as opposed to the top ten stocks driving returns, which was the case prior. Typically, this is a sign of market strength.
All sectors were higher for the month as Consumer Discretionary (+10.93%) led the charge with Industrials (+9.30%) and Materials (+8.97%) not far behind. Utilities was the biggest laggard with a +1.42% return.

Related Articles
March 31, 2023
U.S. Durable Goods Orders were down 1.0% in February, after having been down 5.0% in January.
April 15, 2023
U.S. Factory Orders were down 0.7% in February versus having been down 2.1% in January.
May 1, 2023
The U.S. Index of Leading Economic Indicators was down 1.2% for March after having been down 0.50% for February.


